
Edmonton Housing Market May 2026: What the Data Actually Shows

Homes with Tristan: Edmonton Market Update
Edmonton Housing Market May 2026: What the Data Actually Shows
By Tristan Boire, REALTOR | Park Realty, Sherwood Park AB
New listings in the Greater Edmonton Area jumped 21.7% month-over-month in May 2026. If you heard that number and assumed prices must be falling, you’d be in good company. That’s the natural read. More supply, lower prices. Except that’s not what the data shows.
The GEA detached home average is actually up 4.8% year over year, sitting at $604,744 in May. The market didn’t buckle under the listing surge because demand kept pace. The sales-to-new-listings ratio came in at 53%, right in the middle of balanced territory. This is the data from the REALTORS Association of Edmonton’s May 2026 monthly stats board, and it tells a more nuanced story than “the market is cooling.”
If you want the full video breakdown, I covered this in depth in my June 12 YouTube video — Edmonton Real Estate Market Update: June 2026 — Is Summer the Right Time to Buy? Here’s what the numbers actually show.
Key Takeaways
- → Sales hit 2,557 in May (+3.2% month-over-month). New listings surged to 4,855 but the market absorbed them.
- → Active inventory stands at 7,844 (+23.9% year over year). Months of inventory: 3.1 — firmly in balanced market range.
- → GEA detached average: $604,744 (+4.8% YoY). Condo benchmark: $201,900 (−9.3% YoY). Two very different stories.
- → All-residential days on market: 36 days, up from 29 last May. Buyers have more breathing room than they did a year ago.
- → Source: REALTORS Association of Edmonton (RAE), May 2026 Monthly Stats Board.
What Did Edmonton’s Inventory Actually Do in May?
The short answer: inventory rose significantly, and it didn’t cause a price collapse. The sales-to-new-listings ratio for May 2026 came in at 53% (RAE, May 2026). That sits squarely inside balanced market territory, which RAE defines as 40% to 60%. A hot market runs above 70%. We’re not there, but we’re not in a buyer’s market either.
Here’s the full picture. There were 2,557 sales in May, up 3.2% from April. New listings hit 4,855, a 21.7% month-over-month jump. Active inventory sits at 7,844 units. That’s a 23.9% increase year over year, and it’s real. More homes are sitting on the market than this time last year.
Months of inventory is the metric I pay the most attention to. Right now it’s 3.1 months. That means if no new listings came to market, it would take just over three months to sell everything currently available. Balanced is 3 to 6 months. Below 3 is a seller’s market. Above 6 is a buyer’s market. At 3.1, we’re right at the tipping point between balanced and a seller’s market leaning toward balance.
So why didn’t prices fall when listings jumped 22%? Because buyers showed up too. The listing surge is largely seasonal — families trying to move before the school year, spring sellers finally pulling the trigger. But the demand side didn’t dry up. That’s the key insight. Volume went up on both sides of the ledger.
What Are Homes Actually Selling For?
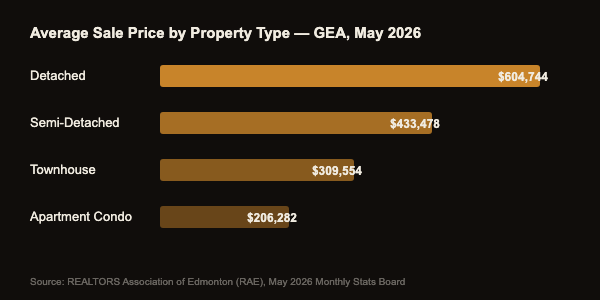
The GEA detached average came in at $604,744, up 4.8% year over year (RAE, May 2026). Detached is holding. That’s the headline. But it’s not the same story across all property types — and the gap is wide enough that it matters a lot depending on what you’re buying or selling.
Here’s a breakdown of all four property types for May 2026. The HPI benchmark is a mix-adjusted price, which strips out changes caused by the types of homes that sold (more luxury sales in a given month inflate the average). The average reflects what actually traded:
- → Detached: HPI benchmark $531,200 (+0.2% YoY — essentially flat). Average $604,744 (+4.8% YoY). The average being above the benchmark suggests some higher-end sales pulling the number up.
- → Semi-detached: Average $433,478 (−1.5% YoY). A modest decline, nothing dramatic.
- → Row/townhouse: Average $309,554 (+0.9% YoY). HPI benchmark $275,200 (−6.6% YoY). The mix-adjusted number is weaker than the average suggests.
- → Apartment condo: Average $206,282 (−3.7% YoY). HPI benchmark $201,900 (−9.3% YoY). The benchmark is down sharply. This is the softest segment in the market.

Why does the HPI benchmark matter more than the average? Because if more expensive homes sell in a given month, the average rises even if no individual home went up in value. The HPI holds the property mix constant, so it’s a truer picture of price movement. The detached HPI benchmark being flat at +0.2% while the average is up 4.8% tells you that higher-end product sold more actively this month — the underlying price pressure on a typical detached home is flat to marginally positive.
The detached and condo markets are moving in opposite directions. Detached benchmark is essentially flat year over year (+0.2%). Condo benchmark is down 9.3% year over year. If you’re comparing a condo purchase to a detached purchase, that divergence changes the math considerably. — RAE May 2026 Monthly Stats Board
For buyers: detached is stable. Condos have softened, which creates opportunity if you’re in that price range and comfortable with the condo model. For sellers: if you have a detached home, you’re sitting on an asset that has held its value through a rising inventory environment. That’s a strong position.
How Long Are Homes Sitting Before They Sell?
The all-residential days on market (DOM) for the GEA rose to 36 days in May 2026, up from 29 days in May 2025 (RAE, May 2026). That’s a meaningful shift. Homes are sitting longer, which means buyers have more time to think, more room to negotiate, and less pressure to waive conditions and rush an offer.
Breaking it down by type:
- → Detached: 33 days (up from 27 last May)
- → Semi-detached: 38 days (up from 25 last May)
- → Apartment condo: 49 days (up from 40 last May)
To put the detached number in historical context: in May 2022, detached DOM was 24 days. That was the hot market peak where homes were gone in under a month and multiple offers were standard. At 33 days, we’re at a healthy, normal market pace. Not a frenzy, not a standstill.
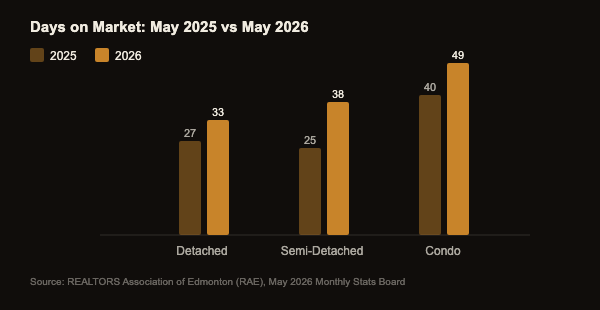
The number that stands out to me is semi-detached: 25 days last May to 38 days this May. That’s a 52% increase year over year — proportionally larger than any other property type. Semi-detached has been popular in Edmonton because it bridges the gap between condo and detached pricing. The DOM jump suggests that segment absorbed a lot of the demand surge already, and sellers are adjusting to a longer timeline. If you’re looking at semi-detached right now, that’s where you may have the most room to negotiate.
Is Summer Actually a Good Time to Buy in Edmonton?
The data doesn’t show a consistent seasonal price premium in Edmonton. What summer does bring is more listings — the 21.7% month-over-month surge we just saw is a seasonal pattern, not a signal of market distress. Families want to be settled before September. Sellers who held through winter finally list. Both sides of the market get more active at the same time.
What does that mean practically? More choice. You have more homes to look at in June and July than you did in February. You’re not more likely to get a deal just because it’s summer — sellers know it too, and they price accordingly. But you’re also not at a disadvantage. The 53% sales-to-new-listings ratio means roughly half of everything that lists is selling each month. The other half is sitting.
From what I’m seeing on the ground, this market feels very different from 2024. Last year there were stretches where well-priced detached homes in desirable areas were getting multiple offers within days. Right now, the same calibre of home might sit 3 to 4 weeks before the seller sees a strong offer. That’s not a down market — prices haven’t meaningfully dropped on detached — but buyers aren’t being rushed the same way. That’s a real change.
The honest answer to “should I wait for summer to buy” or “should I wait for fall” is this: the best time to buy is when you’re financially ready and you’ve found a home that works for you. Trying to time the Edmonton market around the calendar hasn’t historically paid off. What matters more is your pre-approval, your down payment, and your condition period. If you want a walkthrough of exactly how the buying process works in Alberta, I break it all down here: homeswithtristan.ca/buyers.
What the 4-Year Picture Shows
GEA detached homes averaged $505,000 in May 2022 (RAE historical data). In May 2026, that same number is $604,744. That’s a 19.7% gain over four years, through rising interest rates, a Bank of Canada rate hike cycle, inventory climbing 36%, and now a Bank of Canada rate sitting at 2.25%. The long-run direction on Edmonton detached is up.
All-residential average tells a similar story: $427,000 in May 2022, $492,000 in May 2026. That’s 15.2% over four years. Not spectacular, but steady. Ahead of inflation for most of that period.
Condos are the exception. The condo average in May 2022 was roughly $210,000. In May 2026, it’s $206,282. Essentially flat over four years. If you bought a condo in Edmonton in spring 2022 and you’re looking to sell now, you’re likely right around breakeven on price appreciation before costs. This is partly why I don’t spend much time talking about condos — the long-term wealth-building case isn’t as strong as detached.
What’s driving demand in Edmonton over the long run? A few things. The energy sector keeps pulling skilled workers in from across the country. CFB Edmonton is one of Canada’s largest bases, with federal and military employees who need housing. Post-secondary draws students who eventually stay. Healthcare is a major employer. And there’s a steady flow of people from Ontario and BC who look at Edmonton prices and realize they can buy three times the home for the same money they’d spend on a condo in Toronto.
That migration story is real and it’s ongoing. If you’re in that category and trying to figure out what Edmonton actually looks like to live in and buy in, I put together a full relocation guide: homeswithtristan.ca/moving-here.

One last data point worth flagging on the rate environment: the Bank of Canada is at 2.25% right now. Five-year fixed rates are running 4.3% to 4.5%. On a $550,000 to $600,000 purchase with a 20% down payment, that puts your monthly payment somewhere around $2,500 to $2,800. That’s a real number, not a teaser rate, and it’s what I’m walking buyers through right now when we run the pre-approval math together.
Thinking About Buying in Edmonton?
Get Edmonton’s Free Buyer’s Guide
Every step from pre-approval to possession, written for people buying in Edmonton. Free download.
Get the GuideFrequently Asked Questions
Is Edmonton still a buyer’s market in 2026?
Not technically. With 3.1 months of inventory and a sales-to-new-listings ratio of 53%, Edmonton sits in balanced market territory as of May 2026 (RAE). Buyers have more time and choice than in 2024, but sellers on well-priced detached homes aren’t under pressure to discount. It’s a fair fight right now.
Why are condo prices falling while detached is holding?
Supply and demand dynamics differ sharply between segments. Condo inventory has grown faster than buyer demand, partly because investors who bought at the 2022 peak are listing. Detached demand is supported by family-formation buyers and interprovincial migration. The HPI gap tells the story: detached benchmark +0.2% YoY, condo benchmark −9.3% YoY (RAE, May 2026).
What’s the best neighbourhood to buy in Edmonton right now for detached?
It depends on your budget. Glenridding Heights and Glenridding Ravine offer detached in the $550K to $675K range. Keswick averages around $750K. Windermere has entry points from the low $600Ks with an average active listing near $1.6M. Terwillegar and Sherwood Park ($500K to $750K) are strong options for value. St. Albert detached averages $676,188 with a broader range.
Should I wait for prices to drop before buying in Edmonton?
The 4-year data doesn’t support waiting on detached. From May 2022 to May 2026, GEA detached averaged a 19.7% gain through rising inventory and a rate hike cycle. Timing the market is hard. If you’re financially ready and you’ve found a home that works for your life, the math on waiting rarely pencils out when you factor in continued rent payments.
Categories
Recent Posts