Edmonton Home Prices: Average vs Benchmark (Aug 2026)

Edmonton's Average Home Price Is Up. The Number That Actually Matters Is Down.

Edmonton's average home price is up 1.8% from a year ago. If you're a seller, that headline sounds great. But there's a second number covering the exact same market and the exact same twelve months, and it's telling you almost the opposite story: the MLS® Home Price Index benchmark, the number that strips out everything except the true value of a typical home, is down 0.6%.
I walked through the full August 2026 Greater Edmonton Area numbers in this week's video, Edmonton's Cooldown Just Confirmed Itself. This post is the written version. I want to show you exactly where those two numbers split, why they don't agree, and who that gap actually puts at risk right now.
- Average price across all residential types hit $469,602 in August, up 1.8% year over year, while the MLS® HPI benchmark fell to $426,900, down 0.6% over the same period (REALTORS® Association of Edmonton, August 2026).
- GEA sales dropped to 2,143, down 15.4% from July and almost 10% from a year ago, while inventory climbed to 8,052 listings, up more than 15% year over year.
- Condo benchmark prices fell 1.6% year over year with 48 days on market, the slowest of any property type tracked, well behind detached at 38 days.
- City of Edmonton proper sits at 4.2 months of supply, higher than the 3.8-month GEA-wide figure, meaning the core city is further into buyer's-market territory than the regional headline suggests.
Why Edmonton's Average Price and Benchmark Price Disagree
The average price is just math: total sales dollars divided by number of sales. It moves whenever the mix of what sold changes, even if no individual home's value moved at all. The MLS® HPI benchmark works differently. It tracks a "stable property," holding bedrooms, bathrooms, basement finish, lot size, age, and location constant, so it isolates actual value change rather than which homes happened to trade hands that month. The REALTORS® Association of Edmonton publishes both numbers every month.
That's the entire explanation for August. More higher-priced detached homes sold relative to condos, which pulled the average price up to $469,602. Meanwhile the benchmark, which isn't fooled by that mix shift, slid to $426,900. Two numbers, one market, moving in opposite directions for a completely mechanical reason.
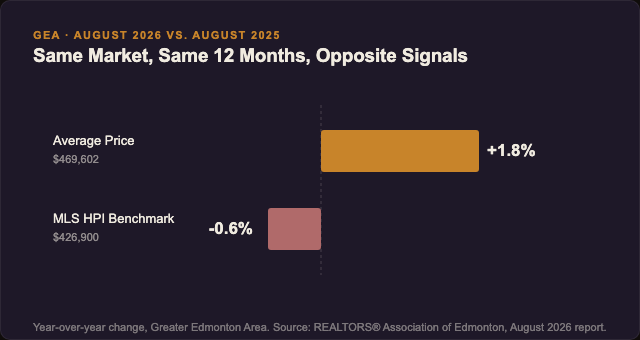
Same market, same 12 months, opposite direction. Source: REALTORS® Association of Edmonton, August 2026.
If you only read headlines, you'd think Edmonton prices are climbing. In my opinion, the benchmark is the number that actually tells you what's happening to a typical home's value, and right now it's telling you the market softened slightly over the past year, not that it grew.
What Actually Happened in Edmonton Real Estate in August 2026
GEA sales came in at 2,143 in August, down 15.4% from July and down almost 10% from August 2025, according to the board's monthly statistics report. New listings sat at 3,769, down about 8% from July but still up 3.3% year to date. Inventory climbed to 8,052 active listings, up more than 15% from last August, and months of supply landed at 3.8.

Detached inventory is building faster than it's clearing, which is exactly what shows up in the months-of-supply number.
Months of supply is the simplest way to read a market's temperature. It tells you how long it would take to sell everything currently listed at the current sales pace. Below about 4 months usually favours sellers, above about 6 usually favours buyers, and 3.8 sits Edmonton right in the middle, tilting toward balanced-to-buyer.
New listings still climbing 3.3% year to date, even after an 8% monthly pullback, tells me sellers haven't gotten the memo yet that this isn't peak spring conditions anymore. More product hitting the market while sales cool is exactly the combination that stretches days on market and softens negotiating leverage for anyone pricing aggressively.
| Metric | August 2026 | Change |
|---|---|---|
| GEA sales | 2,143 | -15.4% MoM, ~-10% YoY |
| New listings | 3,769 | -8% MoM, +3.3% YTD |
| Active inventory | 8,052 | +15%+ YoY |
| Months of supply | 3.8 | Balanced, leaning buyer |
Want to know what your specific home is worth in this market? Use my free Edmonton home valuation tool and I'll walk you through what's actually happening in your neighbourhood, not just the citywide average.
Detached Is Cooling From Strength. Condos Are a Different Story.
Detached homes had 1,302 sales in August at an average price of $575,575, up 1% year over year, with the benchmark down a slim 0.2% and homes averaging 38 days on market (REALTORS® Association of Edmonton, August 2026). That's a category cooling from a position of real strength, not one that's struggling.

Condo days on market stretched to 48 in August, the slowest of any property type the board tracks.
Condos told a different story. 308 sales, benchmark down 1.6% year over year, and 48 days on market, the slowest of any category. Row and townhome came in at 282 sales with the benchmark down 3.1%, the steepest decline of any type, at 45 days on market. Semi-detached had 251 sales at 41 days on market.
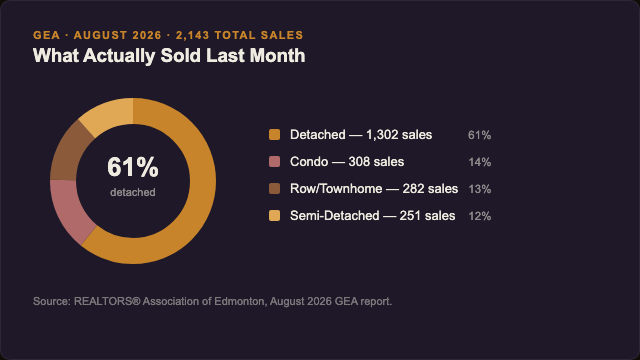
Detached still drives most of the market, but that also means it drives most of the average price swing. Source: REALTORS® Association of Edmonton, August 2026.
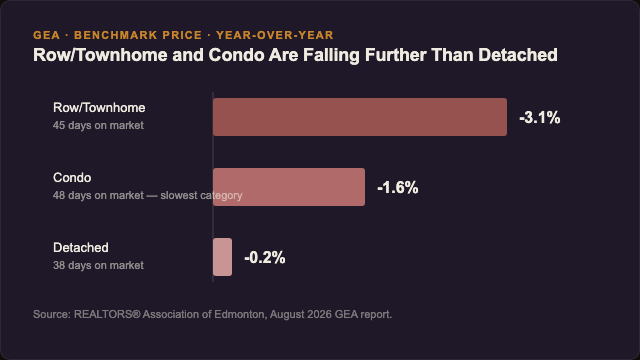
Row/townhome saw the steepest benchmark decline. Condo saw the slowest sales pace. They're two different problems.
I've walked clients through both sides of this split this year. Buyers who are flexible on property type are finding real room to negotiate on condos right now. Sellers listing a condo need to price against other condos in this slower market, not against what a detached home down the street just fetched.
If you're weighing whether a condo still makes sense for your next move, or whether it's time to trade up to detached, my buyer's guide to the Edmonton market breaks down what each property type is actually doing right now, not just the headline number.
Who's Most Exposed Right Now: Overpriced Sellers
Sales down almost 15.5% month over month and near 10% year over year, paired with listings still up 3.3% year to date, is a combination that hits one group hardest: sellers who priced too high. That combination doesn't just mean an overpriced listing sits longer. It means the seller risks eventually taking a lowball offer once one finally does show up.

More listings chasing fewer sales means overpriced homes are the ones that sit, and sitting is what eventually forces a price cut.
There's a geographic layer to this too. The City of Edmonton itself sits at 4.2 months of supply, higher than the 3.8-month GEA-wide number. That means the core city is leaning further into buyer's-market territory than the regional figure suggests, while some surrounding municipalities are holding up better on their own.
If a slower market has you worried about carrying a mortgage that's become a stretch, it's worth understanding what's actually happening with Edmonton mortgage arrears in 2026 before you assume the worst. The two situations aren't the same thing, but they're both symptoms of the same slower pace.
How Does This Compare to the Last Five Years?
August 2026 inventory of 8,052 active listings is nearly back to where it sat in August 2022, right after the post-pandemic correction began. That's a useful anchor. It tells you this isn't some unprecedented flood of listings, it's a return to a supply level Edmonton has seen before and absorbed before. You can track the board's historical trend data yourself through CREA's Edmonton statistics portal.
Practically, more inventory means more choice for buyers and more competition for sellers. It doesn't mean Edmonton is heading toward the kind of correction some other Canadian markets have seen. It means the extreme seller's market conditions from a few years ago have eased back toward something closer to normal, which is a healthier long-term setup even if it feels slower right now.
For context on how this fits into the broader seasonal picture heading into fall, I covered the wider September transition for both buyers and sellers in Edmonton Fall Housing Market 2026: What September Really Changes for Buyers and Sellers. That post covers the calendar shift. This one covers what the actual numbers behind that shift are doing.
What Might September 2026 Look Like?
September 2025's benchmark price was $423,500, about a 1% drop from August 2025, per the board's September 2025 statistics report. My estimate is that September 2026 lands within 1 to 2% of that same number and holds roughly there for the rest of the year. I want to be clear that's my read on the pattern, not a guarantee, but it's grounded in how the last two Septembers have actually behaved.
Edmonton tends to see a modest seasonal pullback from August into September as the summer rush fully clears out. Nothing in this month's numbers suggests 2026 breaks that pattern. If anything, the inventory build and slower sales pace both point toward more of the same softening, not a sudden reversal in either direction.
My Take: If You Have Time, This Is the Moment to Prep, Not List
If you're a seller and you're not on a deadline, I don't think this is the month to list. I think it's the month to prepare. Get your listing photos taken now while the yard still looks good and the light's still working in your favour, then plan to actually list in February or March when the market historically heats back up.
If you're working against a real deadline, a job transfer, a growing family, a life change that doesn't wait for spring, the math is different for you. That's not a blog post conversation, that's a direct one, and I'd rather walk through your specific numbers than give you generic advice that doesn't fit your situation.
Not sure if your home's value moved with the average or the benchmark?
Get a free, no-obligation home valuation and I'll tell you straight what your property's actually worth in today's Edmonton market.
Get My Free Home ValuationFrequently Asked Questions
What's the difference between Edmonton's average home price and the MLS HPI benchmark price?
The average price divides total sales dollars by number of sales, so it shifts with whatever mix of homes sold that month. The MLS® HPI benchmark tracks a fixed "typical" property instead, which is why Edmonton's average rose 1.8% while the benchmark fell 0.6% over the same 12 months (REALTORS® Association of Edmonton, August 2026).
Are Edmonton condo prices dropping in 2026?
Yes. The condo benchmark price fell 1.6% year over year as of August 2026, and condos are averaging 48 days on market, the slowest of any property type tracked by the board (REALTORS® Association of Edmonton, August 2026). Row and townhome saw an even steeper benchmark decline of 3.1%.
Is now a good time to sell a house in Edmonton?
It depends on your timeline. With sales down almost 10% year over year and inventory up more than 15%, sellers without a deadline may benefit from prepping now and listing in February or March 2027 when activity historically picks back up. Sellers on a real deadline should get personalized advice instead of general market timing.
What does "months of supply" mean and why is Edmonton at 3.8?
Months of supply estimates how long it would take to sell every active listing at the current sales pace. Edmonton's GEA-wide figure was 3.8 in August 2026, while the City of Edmonton alone sat higher at 4.2, both landing in balanced-to-buyer territory (REALTORS® Association of Edmonton, August 2026).
Will Edmonton home prices keep falling into 2027?
Based on the seasonal pattern from September 2025, when the benchmark dropped about 1% from August to land at $423,500, my estimate is September 2026's benchmark lands within 1 to 2% of that figure and holds through the rest of the year, barring a shift in the current trend.
Two numbers, same market, same twelve months. The average tells you what sold. The benchmark tells you what your home is actually worth. If you want to know which one applies to your specific property, that's a conversation, not a headline, and I'm always glad to have it.
Categories
Recent Posts