Edmonton Real Estate Market Update September 2026

Homes with Tristan: Market Update
Edmonton Real Estate Market Update: Why the Suburbs Are Winning (September 2026)
By Tristan Boire, REALTOR | Park Realty, Sherwood Park AB

Edmonton's average home price is up almost three percent from last year. Sounds healthy. But the benchmark price, the number that strips out whatever happens to be selling and gives you the cleanest read on real value, is down in both the region and the city, and it's down six times as much inside the city as it is across the whole area. Those two numbers shouldn't be able to say opposite things about the same market. Right now they do.
I pulled the official September numbers from the Realtors Association of Edmonton, then added my own live suburb-by-suburb listing pull on top of it, and the picture that comes out is pretty clear: Edmonton's suburbs are quietly outperforming the city right now. If you're buying or selling anywhere in the Edmonton area this fall, that gap should change how you think about your own numbers. I broke down exactly where it's happening in this month's video, and this post walks through the data behind it.
Key Takeaways
- • The Greater Edmonton Area average sale price hit $466,080 in September 2026, up 2.9% year over year, while the MLS benchmark price fell 0.3% YoY region-wide (Realtors Association of Edmonton, Sept 2026).
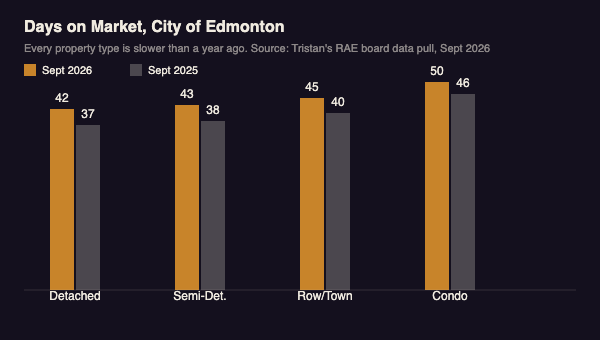
- • Every property type is sitting longer than a year ago – detached homes averaged 42 days on market in the city versus 37 last September.
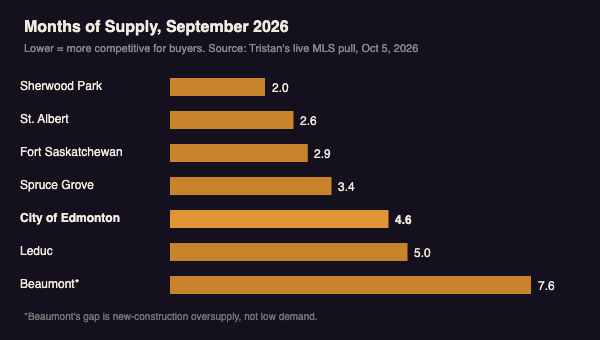
- • Sherwood Park is sitting at roughly 2.0 months of supply and St. Albert around 2.6, compared to 4.6 months inside the City of Edmonton, based on my own live MLS pull from Oct 5, 2026.
- • Average condo prices are up region-wide, but the median condo price is down over 4% YoY – a sign only the better-maintained, higher-priced units are holding value.
Edmonton's Average Price Is Up. The Benchmark Price Tells a Different Story.
The Greater Edmonton Area's average residential sale price was $466,080 in September 2026, up 2.9% from a year earlier (Realtors Association of Edmonton, 2026). That's the number most headlines will repeat. But the average gets dragged around by whatever happened to sell that month – a run of detached sales in one neighbourhood can push it up even if the broader market is flat.
The MLS Home Price Index benchmark is the cleaner read, because it tracks a consistent typical home rather than whatever's closing. That benchmark sat at $423,100 region-wide in September, down 0.9% month over month and 0.3% year over year (Realtors Association of Edmonton, 2026). Pulling the City of Edmonton figures out of the board's detailed report separately from the regional number, which isn't in the public release, the city-only benchmark is down closer to 1.8% year over year, six times the region-wide decline. Single-family benchmarks tell the same story: $518,900 region-wide against roughly $513,000 inside the city itself, based on the same detailed report.
When Edmonton's average price and benchmark price move in opposite directions, the average is being propped up by what's selling, not by what the typical home is actually worth. In September 2026 that gap was six times wider inside the City of Edmonton than across the region as a whole.
In plain terms: if you're selling inside the city and pricing off last year's comps, or off the "average is up" headline, you're probably pricing too high for where the market actually sits today.
Homes Are Sitting Longer, Across Every Property Type
It isn't one segment dragging the market down. Detached homes in the City of Edmonton averaged 42 days on market this September versus 37 a year ago. Semi-detached went from 38 to 43 days. Row and townhomes moved from 40 to 45. Condos went from 46 to 50. Every category is slower, which tells me this is a broad shift, not a one-category problem.
That's happening because new listings across the region are up 7.2% month over month and 11.3% year over year, while sales are down 8.8% month over month and 10.3% year over year (Realtors Association of Edmonton, 2026). More sellers are testing the market at the same time fewer buyers are closing, and that's exactly what pushes months of supply higher and hands buyers more leverage. Inside the city specifically, months of supply has crept up to 4.6, which is creeping into buyer's-market territory.
The Condo Story Nobody's Talking About
Here's the one that actually surprised me. Condo prices across the region are up 0.6% year over year, even though condo sales fell more than 15% compared to last September. Fewer condos are selling, but the ones that do close are holding their price better than detached or row homes right now.

There's another layer worth pulling apart here, because the average and the median tell two different stories. The average condo price is up 0.6% region-wide, but the median, the true middle of the market, is actually down over 4% year over year. Inside the city specifically, that gap is wider still: the average is up about 1% while the median is down close to 8%. When the average rises while the median falls like that, the top end is pulling the number up. Well-maintained, higher-priced units are seeing real demand, while the typical condo in the middle of the pack is getting cheaper. That's a very different story than "condos are doing fine," and it matters depending on which end of the market you're shopping or selling into.
Why St. Albert and Sherwood Park Are Beating the City Right Now
I pulled the live numbers myself this week, not the monthly summary report but the actual current listings, and the gap is bigger than I expected. St. Albert has 262 total listings right now, 213 active and 49 already pending, with 102 sales in the last 30 days. That works out to about 2.6 months of supply. Sherwood Park is even tighter: 225 total listings, 185 active, 40 pending, 112 sales in the last 30 days, putting it at roughly 2.0 months of supply. Compare that to 4.6 months in the city itself. That's not a small gap – that's the difference between a balanced market and a genuinely competitive one.
| Area | Months of Supply | Median / Avg DOM |
|---|---|---|
| Sherwood Park | ~2.0 | 17 / 31 days |
| St. Albert | ~2.6 | 22 / 38 days |
| Fort Saskatchewan | ~2.9 | — |
| Spruce Grove | ~3.4 | — |
| City of Edmonton | 4.6 | avg 46 days |
| Leduc | ~5.0 | — |
| Beaumont* | ~7.6 | — |
*Beaumont's wider supply is almost entirely new-home construction flooding the area with options, not low desirability. Source: Tristan's own live MLS pull, Oct 5, 2026.
It's Not the Commute. It's the Density.
In my experience talking to clients, commute time rarely drives this decision anymore. Most people tell me their drive ends up being pretty similar either way, even with construction on a lot of the major roads into the city. What I hear instead is people wanting a slower pace of life, and honestly, a lot of it comes down to how someone feels about density. The city is growing fast, and with that growth comes more infill, more traffic, more people competing for the same infrastructure. Some people are completely fine with that; they want to be close to the restaurants and everything else that comes with it. Other people want out of it entirely. That's genuinely the dividing line I see, not price, not commute, just whether someone minds the city getting bigger around them.
What This Means If You're Buying or Selling Right Now
- • Condo shoppers: the overall slowdown isn't the bargain it looks like. The units actually selling are going to serious buyers, and it's the better-maintained, higher-priced units holding value, not the discount end.
- • Detached buyers weighing city versus suburb: think about the density question honestly before you think about price. The suburbs are winning on speed and competition either way right now.
- • Sellers inside the city: price to what the data is showing today, not what your neighbour got a year ago. A 4.6-month supply market doesn't forgive an optimistic list price the way last year's market did.
- • Buyers specifically wanting new construction: Beaumont's oversupply is worth a look precisely because of the extra negotiating room it creates.

Thinking About Your Own Numbers
Not Sure What Your Home Is Actually Worth Right Now?
With the benchmark price moving differently than the average, a year-old estimate won't cut it. Get a real read on where your home sits today.
Get Your Free Home ValuationFrequently Asked Questions
What is Edmonton's benchmark price, and how is it different from the average price?
The benchmark price tracks a consistent "typical" home over time, while the average price reflects whatever actually sold that month. In September 2026 the GEA average was $466,080 (up 2.9% YoY) while the benchmark was $423,100 (down 0.3% YoY), showing the average was propped up by what sold, not by rising typical value (Realtors Association of Edmonton, 2026).
Is Edmonton a buyer's market in September 2026?
The City of Edmonton is creeping into buyer's-market territory at 4.6 months of supply, while nearby suburbs like Sherwood Park (about 2.0 months) and St. Albert (about 2.6 months) remain far tighter. Whether it favors buyers or sellers right now genuinely depends on which specific area you're looking at.
Why are condo prices rising even though condo sales are falling?
Condo sales fell over 15% year over year, but the average price still rose 0.6% because the condos that are selling skew toward better-maintained, higher-priced units. The median condo price actually fell over 4% YoY, meaning typical, mid-market condos are getting cheaper even as the average climbs.
Which Edmonton-area suburb has the tightest housing supply right now?
Sherwood Park is the tightest at roughly 2.0 months of supply, based on a live MLS pull of 225 total listings and 112 sales in the prior 30 days. St. Albert follows closely at about 2.6 months, both well under the City of Edmonton's 4.6 months.
Is now a good time to sell a home in the City of Edmonton?
It depends on pricing discipline more than timing. With months of supply at 4.6 and days on market up across every property type, sellers who price to this month's data, not last year's, are still finding buyers. Sellers pricing off outdated comps are the ones sitting longest.
The gap between the city and the suburbs is bigger than most people realize right now, and it's the kind of thing that only shows up when you go past the headline average and into the benchmark and the live listing data underneath it. If any of this sounds like where you're at, whether you're buying, selling, or just trying to figure out what your own numbers look like, reach out directly. I'd rather walk you through your specific situation than have you guess from a regional average.
Categories
Recent Posts